Unless otherwise noted all content, images and text were created by and are the copyright 1983, 2003-2016 of Mike Strong - No copying or duplication is allowed without express permission from Mike Strong - kcdance.com, artfuldancer.com
Measuring Data and Its Limits
This lesson is conceptual rather than hands on. It is designed to bring thinking into the way you choose what data to track and what to do with that data.
- Intended Outcome
- write a short article (400 words minimum) about the value of measuring
- Identify what is being measured
- Identify the use the measurement is being used for?
- determine how well this measurement identifies the cliamed condition(s)
- ask whether the data measured and used for diagnosis is comprehensive
- ask whether a baseline was determined before prescribing a solution
- state whether the pescribed solution worked to bring the readings into compliance
- and state how well this compliance works
- are there alternates?
- Email the article to me
- write a short article (400 words minimum) about the value of measuring
What was the original item measured? Blood Pressure.
What was the remedy prescribed? Blood pressure pills.
How representative was the original data? one or two visits to the clinic, so, one or two measurements.
Did baseline data exist? No, the one or two readings from the clinic were used as is.
What are the causes of higher blood pressure? Many, pain, etc.
A Major figure in data
W.Edwards Demming was world famous. Statistician, engineer, management consultant, professor. Demmings was one of the developers of the sampling techniques for population census across the world.He was credited as helping inspire Japan's post-war economic recovery.
He was a data person. He gathered all kinds of data and used that data to measure people and production. Demming also understood the limits of measuring.
Demming said, "The most important things cannot be measured" adding that you might be measuring something important now without realizing it until later.
Those trying to sell someone on measuring something, usually performance, are known to use a version of this lift from the middle of a quote: "You can't manage what you can't measure" in order to use Demming as their authority for their sales push, but that, by itself, is a direct mis-quote and has the opposite meaning of Demming's sentence.
What he really said was, "It is wrong to suppose that if you can't measure it, you can't manage it – a costly myth."
He also counted operating a company on visible figures alone, as one of his seven deadly management diseases.
Reference: https://en.wikipedia.org/wiki/W._Edwards_Deming#Deming_philosophy_synopsis
How My Blood Pressure Revealed a Lack of Diagnostic Data
Numbers (measurements) Mean More Than the Numbers
When I signed up at the VA I went in for physicals, including labs. The blood pressure data measured by the VA led them to prescribe blood pressure pills for me. The lowest dosage pills (HCTZ 12.5 mg / Lisinopril 10 mg - 1 tablet every morning). They also mailed me a blood pressure monitor. I already had one but I've been using this one almost exclusively since they sent it.
I intended to be a proper patient and take those pills on schedule until May 4th, 2015 when I was shooting head shots for Wylliams/Henry dance company. It was all I could do to get through the session and as I was packing up gear I had to sit on the floor to keep from collapsing totally. When I got home I checked my blood pressure. It was low, very low, at 83/58 with a pulse of 88 (normal is generally considered to be 120/80).
Very short list of possible problems under "overdose" from the label reprinted here (and many other places, just Google it)
"The most common signs of an overdose are a feeling of light-headedness or dizziness (this is because your blood pressure is falling) and changes in your salt balance. In case of a severe fall in blood pressure, the patient should be placed in the shock position (lying flat on the back with legs elevated)."There is a vastly longer list of problems under "side effects"
This sets up an obvious question, "Is the prescription merely treating the measurement?" A parallel question would be "Are you teaching to the test?" The point, within this class, is not to tell about my blood pressure but rather to think about what and why we measure anything.
What to do? I needed to change something to figure out what had caused this. It so happened I was in the middle of a course of antibiotics so I clearly wanted to avoid stopping those pills. I could always restart the blood pressure pills so I did. Then I added something, I decided to get outside and exercise. I started walking, as if I were late for work in KC or normal for NYC.
Right from the start I took before and after readings. Right from those first sets of readings I saw that whatever the blood pressure measured at the start, by the time I was done walking, the pressure was down to normal or even a low normal. From this point on I began an experiment, fully intending to check it later by going back on the pills to see what happened.
I haven't done the second part yet. I kept wanting to see how far this would continue. To date (this writing, Feb 2016) I have nearly 2000 individual measurements, averaged in small groups, which show that the pattern is consistent and controllable.
At the same time I realized that the BP numbers themselves are not the goal. They mean things beyond the mere numbers. BP is both a condition (hydraulic pressure) and a symptom generated by other conditions. I began to notice that BP alerted my to other conditions, such as inflamations, headaches and so forth.
Changing lifestyle rather than taking pills to change the BP numbers gives me other benefits in overall conditioning, most noticeable in better breath control going up stairs. I had noticed that the two and three flights of stairs in Royall and in PAC that I used to take bounding up the stairs, and still do, left me half out of breath at the top.
After a few weeks walking I realized one day that I was going up those stairs without having to pause at the top to catch my breath before going down the hall. Had I taken the pills I would have those lower BP numbers but I would be at least as out of breath, and I suspect worse (having nearly collapsed earlier). To me that meant the pills did nothing for my overall conditioning.
I further realized that even though I am active, shooting video and stills for concerts, carrying heavy equipment, setting up, breaking, moving around, when I get back I am seated in front of a computer for hours and hours well into the early morning after a concert. To my surprise I was actually actively sedentary.
I came to realize that for all their knowledge doctors are helpless without good data and other information. Taking a reading in a doctor's office and using that reading to represent a patient's overall condition is just not enough information. If that is all you have, well, that is all you have. Nuff said. But as a sampling method, very inadequate regardless of whether we are talking blood pressure or polling potential voters.
I've watched my own blood pressure jump up or down even during a period of measurement. Usually the systolic reading is more volatile. I suspect the monitor as a device has a problem detecting the systolic starting point. As a result I fairly quickly began making sure that I usually take 3 usable readings.
Three usable readings means that I may well take additional readings if the numbers go too high or too low without seeming to be a part of the pattern of readings, an outlier. The outlier readings might have various reasons, some might be me and some the instrument, the batteries, noise in the room and who knows? And once in a while I just get curious to see where the readings in a set of readings are going before I decide what to average. While I am not sure of all the reasons for the variances I feel confident believing that they are not always all accurate readings of my blood pressure.
I take readings daily and readings around events. So I have more data, maybe not better monitors but certainly not that far from what a clinical blood pressure monitor would have recorded. That means that I have a responsibility to try to get that information to the doctor as best I can. I have a lot of confidence in the doctor just not as much confidence in the data the doctor has available for a diagnosis.
I've been in similar positions often enough as a software developer trying to debug a commercial program. You need the best information you can get, the best description (not conclusion) and you need to be able to reproduce the error in order to locate the problem and fix it.
Individual Readings and their averages for two days
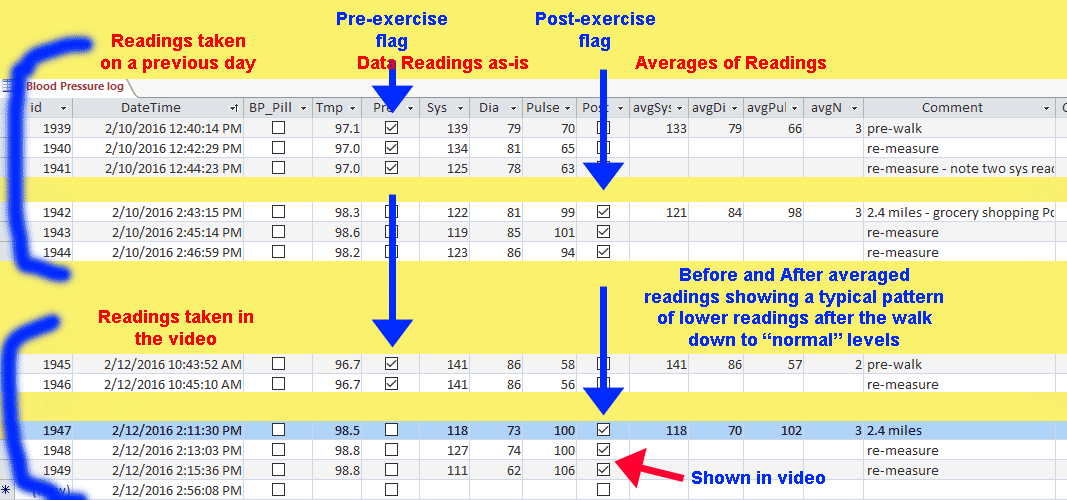
As shown in this illustration created from a screen capture of the blood-pressure database the before-walk readings are higher than the readings after walking. This particular day I took only two before-walk readings to average rather than my usual three minimum. The reason is that the two readings were exactly the same (141/86). Only the pulse differed and by a mere two beats per minute.
Two queries from the blood pressure database - Before and After
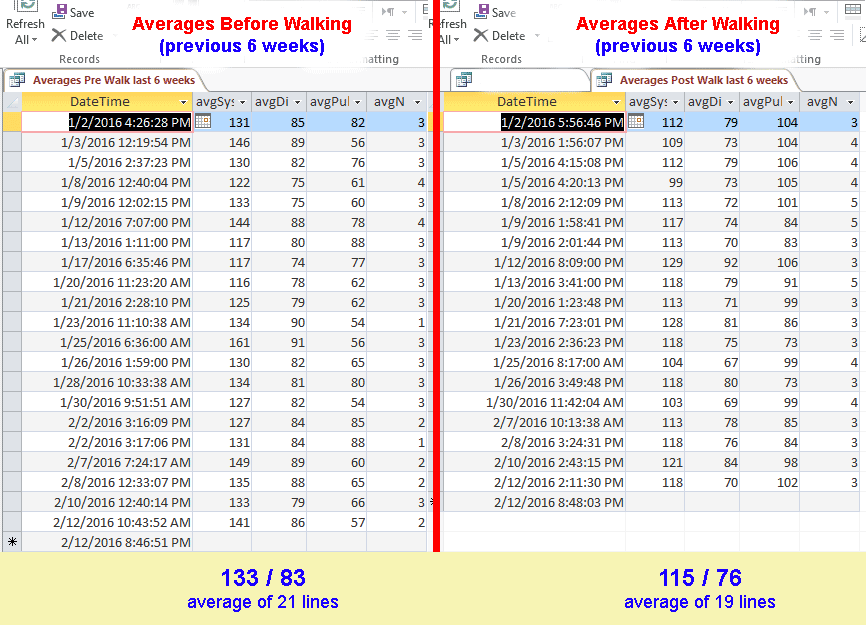
- In the adjacent screen captures above we are looking at two queries.
- Both queries show only averaged readings
- Both queries show only the last six weeks
- The query on the left shows the averaged readings before each walk
- The query on the right shows the averaged readings after each walk
- A quick glance over both of these queries gives the impression that walking lowers blood pressure
- Taking an average of the two queries shows
- systolic is lowered by 18
- diastolic is lowered by 7
- The before average is a little higher than normal (120/80)
- The after average is in normal range
Monthly Averages For 11 Months
The table below is a direct export from the Access database with my blood pressure table.
This is output from a query (a saved question, see "Week 6 - Query Search" if you need.)
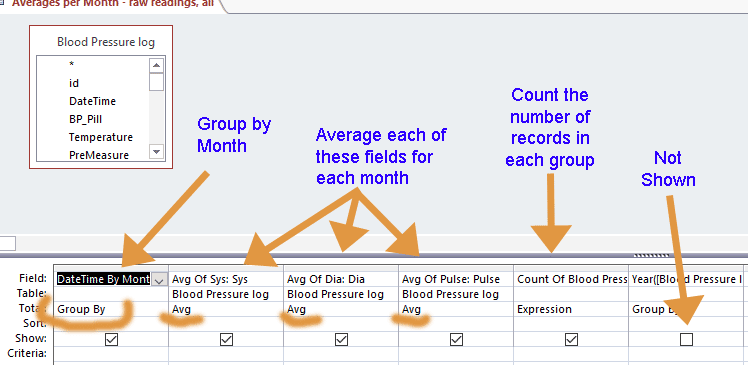
The query averages all the readings, grouping by month.
| Month, Year | Systolic | Diastolic | Pulse | Number of averaged Measurements |
|---|---|---|---|---|
| April 2015 | 129.15 | 84.14 | 85.20 | 257 |
| May 2015 | 123.04 | 81.63 | 79.38 | 436 |
| June 2015 | 119.88 | 80.49 | 79.50 | 197 |
| July 2015 | 123.71 | 81.83 | 74.36 | 186 |
| August 2015 | 121.10 | 81.09 | 73.15 | 166 |
| September 2015 | 121.38 | 80.49 | 76.71 | 132 |
| October 2015 | 119.85 | 78.47 | 72.84 | 182 |
| November 2015 | 125.21 | 83.60 | 75.61 | 133 |
| December 2015 | 124.85 | 81.82 | 83.93 | 88 |
| January 2016 | 122.38 | 78.84 | 82.97 | 109 |
| February 2016 | 128.53 | 82.59 | 79.31 | 32 |
Here is the query
You can see that the blood pressure is just skirting north of 120/80 as an average. The readings in the doctor's office were higher, considerably higher. Overall readings vary by reading, by time of day, and just for kicks (as far as I can tell) in ways which don't seem to have a reason.
| Month | From Pre-walk readings | From Post-walk readings | |||||
|---|---|---|---|---|---|---|---|
| Systolic | Diastolic | Pulse | Number | Systolic | Diastolic | Pulse | |
| April 2015 | 129.78 | 82.78 | 80.05 | 257 | 119.93 | 81.29 | 97.81 |
| May 2015 | 130.17 | 83.47 | 63.25 | 436 | 114.34 | 78.78 | 97.37 |
| June 2015 | 130.24 | 84.51 | 62.20 | 197 | 111.93 | 77.25 | 94.27 |
| July 2015 | 139.92 | 87.13 | 57.72 | 186 | 115.97 | 79.83 | 83.77 |
| August 2015 | 130.13 | 84.59 | 62.63 | 166 | 113.51 | 78.06 | 81.88 |
| September 2015 | 128.81 | 84.05 | 67.52 | 132 | 114.19 | 77.32 | 84.86 |
| October 2015 | 129.81 | 82.37 | 61.98 | 182 | 111.33 | 75.80 | 82.01 |
| November 2015 | 135.03 | 85.83 | 65.89 | 133 | 116.60 | 81.38 | 84.32 |
| December 2015 | 130.97 | 83.43 | 72.89 | 88 | 119.25 | 79.90 | 96.15 |
| January 2016 | 132.00 | 81.52 | 68.23 | 109 | 113.89 | 76.32 | 94.34 |
| February 2016 | 135.81 | 86.77 | 67.31 | 62 | 119.56 | 78.39 | 92.91 |
In the table above I am again averaging readings but this time I am placing averages for pre-walk measurements on the left side and averages of measurements after walking on the right side.
Going further with the query above we can massage the data another way, with the averages per month: on the left the plain averages and on the right the before and after averages for Systolic and Diastolic and then we can export it to Excel and graph the average to compare them visually.
| Month | All Readings Averaged (pre-walk, post-walk and all others) | Averaged readings: pre and post walk | ||||||||
|---|---|---|---|---|---|---|---|---|---|---|
| Systolic | Diastolic | Pulse | ||||||||
| Systolic | Diastolic | Pulse | Number | Pre | Post | Pre | Post | Pre | Post | |
| 2015-04 April | 129.15 | 84.14 | 85.20 | 257 | 129.78 | 119.93 | 82.78 | 81.29 | 80.05 | 97.81 |
| 2015-05 May | 123.04 | 81.63 | 79.38 | 436 | 130.17 | 114.34 | 83.47 | 78.78 | 63.25 | 97.37 |
| 2015-06 June | 119.88 | 80.49 | 79.50 | 197 | 130.24 | 111.93 | 84.51 | 77.25 | 62.20 | 94.27 |
| 2015-07 July | 123.71 | 81.83 | 74.36 | 186 | 139.92 | 115.97 | 87.13 | 79.83 | 57.72 | 83.77 |
| 2015-08 August | 121.10 | 81.09 | 73.15 | 166 | 130.13 | 113.51 | 84.59 | 78.06 | 62.23 | 81.88 |
| 2015-09 September | 121.38 | 80.49 | 76.71 | 132 | 128.81 | 114.19 | 84.05 | 77.32 | 67.52 | 84.86 |
| 2015-10 October | 119.85 | 78.47 | 72.84 | 182 | 129.81 | 111.33 | 82.37 | 75.80 | 61.98 | 82.01 |
| 2015-11 November | 125.21 | 83.60 | 75.61 | 133 | 135.03 | 116.60 | 85.83 | 81.38 | 65.89 | 84.32 |
| 2015-12 December | 124.85 | 81.82 | 83.93 | 88 | 130.97 | 119.25 | 83.43 | 79.90 | 72.89 | 96.15 |
| 2016-01 January | 122.38 | 78.84 | 82.97 | 109 | 132.00 | 113.89 | 81.52 | 76.32 | 68.23 | 94.34 |
| 2016-02 February | 125.97 | 81.16 | 81.69 | 79 | 138.44 | 115.73 | 87.29 | 76.28 | 66.26 | 93.61 |
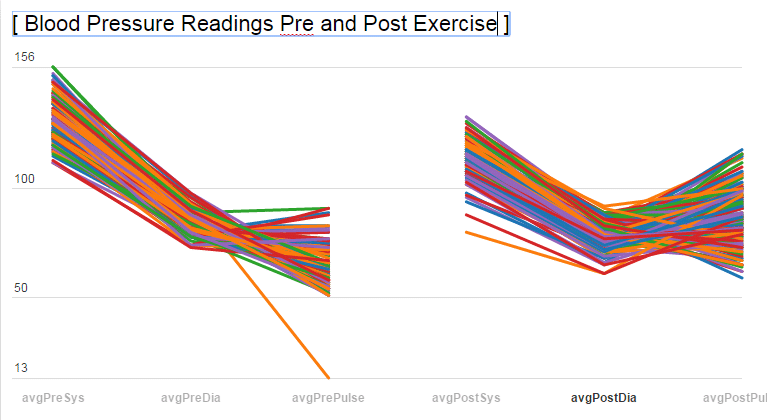
You can see it more graphically in this chart created by first exporting this query to Excel and then creating a line graph in Excel. I took a screen capture of the graph then added text and arrows in Photoshop.
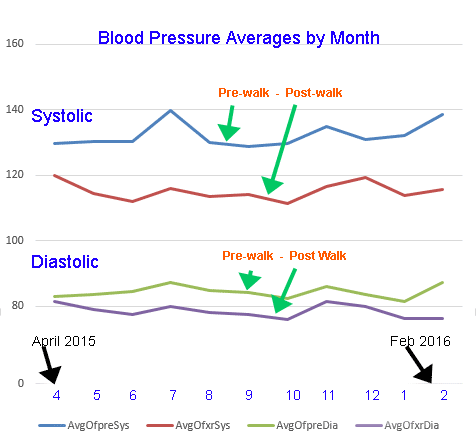
The averages of readings after walking are always lower than the before readings.
The walk is usually either 2 or 2.4 miles and brisk. I have three main locations and a hash list of places and distances. I also try to give myself something to do with each walk, often going to one of the nearby grocery stores to do a small bit of shopping and returning with it to eat. That gives me an extra prod. I also walk as if I were late to work and need to get there. No special "olympic walker" walk. Just everyday brisk walking.
Some days I take a camera, sometimes I listen to music on headphones, sometimes I just walk. I alway enjoy being outside, even in freezing or very hot weather though I prefer the heat. Snow and rain are a tad different and ice is tricky but I am out regardless. This is becoming something I feel I have to do. At least that is my aim in making this a near-always daily discipline.
Because the doctor's data was limited to only a few readings the doctor, in good faith, is dealing with limited data to make a diagnosis and prescribe pills. For the most part, there are really no good ways in common use which provide reliable data with a firm baseline to medical professionals for each patient.
There is a device which can be worn for 24 hours and which takes readings at intervals during those 24 hours. It is then returned to the doctor's office. This certainly gives more readings than can be achieved in a visit to the doctor but hardly comprehensive compared to months of regularly-recorded data. Further it is doctor-centric at a distance and because the intervals are pre-set, can't tell us anything about events such as exercise.
Unless otherwise noted all content, images and text were created by and are the copyright 1983, 2003-2016 of Mike Strong - No copying or duplication is allowed without express permission from Mike Strong - kcdance.com, artfuldancer.com